888 BOT #alerts█ 888 BOT #alerts (open source)
This is an Expert Advisor 'EA' or Automated trading script for ‘longs’ and ‘shorts’, which uses only a Take Profit or, in the worst case, a Stop Loss to close the trade.
It's a much improved version of the previous ‘Repanocha’. It doesn`t use 'Trailing Stop' or 'security ()' functions (although using a security function doesn`t mean that the script repaints) and all signals are confirmed, therefore the script doesn`t repaint in alert mode and is accurate in backtest mode.
Apart from the previous indicators, some more and other functions have been added for Stop-Loss, re-entry and leverage.
It uses 8 indicators, (many of you already know what they are, but in case there is someone new), these are the following:
1. Jurik Moving Average
It's a moving average created by Mark Jurik for professionals which eliminates the 'lag' or delay of the signal. It's better than other moving averages like EMA , DEMA , AMA or T3.
There are two ways to decrease noise using JMA . Increasing the 'LENGTH' parameter will cause JMA to move more slowly and therefore reduce noise at the expense of adding 'lag'
The 'JMA LENGTH', 'PHASE' and 'POWER' parameters offer a way to select the optimal balance between 'lag' and over boost.
Green: Bullish , Red: Bearish .
2. Range filter
Created by Donovan Wall, its function is to filter or eliminate noise and to better determine the price trend in the short term.
First, a uniform average price range 'SAMPLING PERIOD' is calculated for the filter base and multiplied by a specific quantity 'RANGE MULTIPLIER'.
The filter is then calculated by adjusting price movements that do not exceed the specified range.
Finally, the target ranges are plotted to show the prices that will trigger the filter movement.
Green: Bullish , Red: Bearish .
3. Average Directional Index ( ADX Classic) and ( ADX Masanakamura)
It's an indicator designed by Welles Wilder to measure the strength and direction of the market trend. The price movement is strong when the ADX has a positive slope and is above a certain minimum level 'ADX THRESHOLD' and for a given period 'ADX LENGTH'.
The green color of the bars indicates that the trend is bullish and that the ADX is above the level established by the threshold.
The red color of the bars indicates that the trend is down and that the ADX is above the threshold level.
The orange color of the bars indicates that the price is not strong and will surely lateralize.
You can choose between the classic option and the one created by a certain 'Masanakamura'. The main difference between the two is that in the first it uses RMA () and in the second SMA () in its calculation.
4. Parabolic SAR
This indicator, also created by Welles Wilder, places points that help define a trend. The Parabolic SAR can follow the price above or below, the peculiarity that it offers is that when the price touches the indicator, it jumps to the other side of the price (if the Parabolic SAR was below the price it jumps up and vice versa) to a distance predetermined by the indicator. At this time the indicator continues to follow the price, reducing the distance with each candle until it is finally touched again by the price and the process starts again. This procedure explains the name of the indicator: the Parabolic SAR follows the price generating a characteristic parabolic shape, when the price touches it, stops and turns ( SAR is the acronym for 'stop and reverse'), giving rise to a new cycle. When the points are below the price, the trend is up, while the points above the price indicate a downward trend.
5. RSI with Volume
This indicator was created by LazyBear from the popular RSI .
The RSI is an oscillator-type indicator used in technical analysis and also created by Welles Wilder that shows the strength of the price by comparing individual movements up or down in successive closing prices.
LazyBear added a volume parameter that makes it more accurate to the market movement.
A good way to use RSI is by considering the 50 'RSI CENTER LINE' centerline. When the oscillator is above, the trend is bullish and when it is below, the trend is bearish .
6. Moving Average Convergence Divergence ( MACD ) and ( MAC-Z )
It was created by Gerald Appel. Subsequently, the histogram was added to anticipate the crossing of MA. Broadly speaking, we can say that the MACD is an oscillator consisting of two moving averages that rotate around the zero line. The MACD line is the difference between a short moving average 'MACD FAST MA LENGTH' and a long moving average 'MACD SLOW MA LENGTH'. It's an indicator that allows us to have a reference on the trend of the asset on which it is operating, thus generating market entry and exit signals.
We can talk about a bull market when the MACD histogram is above the zero line, along with the signal line, while we are talking about a bear market when the MACD histogram is below the zero line.
There is the option of using the MAC-Z indicator created by LazyBear, which according to its author is more effective, by using the parameter VWAP ( volume weighted average price ) 'Z-VWAP LENGTH' together with a standard deviation 'STDEV LENGTH' in its calculation.
7. Volume Condition
Volume indicates the number of participants in this war between bulls and bears, the more volume the more likely the price will move in favor of the trend. A low trading volume indicates a lower number of participants and interest in the instrument in question. Low volumes may reveal weakness behind a price movement.
With this condition, those signals whose volume is less than the volume SMA for a period 'SMA VOLUME LENGTH' multiplied by a factor 'VOLUME FACTOR' are filtered. In addition, it determines the leverage used, the more volume , the more participants, the more probability that the price will move in our favor, that is, we can use more leverage. The leverage in this script is determined by how many times the volume is above the SMA line.
The maximum leverage is 8.
8. Bollinger Bands
This indicator was created by John Bollinger and consists of three bands that are drawn superimposed on the price evolution graph.
The central band is a moving average, normally a simple moving average calculated with 20 periods is used. ('BB LENGTH' Number of periods of the moving average)
The upper band is calculated by adding the value of the simple moving average X times the standard deviation of the moving average. ('BB MULTIPLIER' Number of times the standard deviation of the moving average)
The lower band is calculated by subtracting the simple moving average X times the standard deviation of the moving average.
the band between the upper and lower bands contains, statistically, almost 90% of the possible price variations, which means that any movement of the price outside the bands has special relevance.
In practical terms, Bollinger bands behave as if they were an elastic band so that, if the price touches them, it has a high probability of bouncing.
Sometimes, after the entry order is filled, the price is returned to the opposite side. If price touch the Bollinger band in the same previous conditions, another order is filled in the same direction of the position to improve the average entry price, (% MINIMUM BETTER PRICE ': Minimum price for the re-entry to be executed and that is better than the price of the previous position in a given %) in this way we give the trade a chance that the Take Profit is executed before. The downside is that the position is doubled in size. 'ACTIVATE DIVIDE TP': Divide the size of the TP in half. More probability of the trade closing but less profit.
█ STOP LOSS and RISK MANAGEMENT.
A good risk management is what can make your equity go up or be liquidated.
The % risk is the percentage of our capital that we are willing to lose by operation. This is recommended to be between 1-5%.
% Risk: (% Stop Loss x % Equity per trade x Leverage) / 100
First the strategy is calculated with Stop Loss, then the risk per operation is determined and from there, the amount per operation is calculated and not vice versa.
In this script you can use a normal Stop Loss or one according to the ATR. Also activate the option to trigger it earlier if the risk percentage is reached. '% RISK ALLOWED' wich is calculated according with: '%EQUITY ON EACH ENTRY'. Only works with Stop Loss on 'NORMAL' or 'BOTH' mode.
'STOP LOSS CONFIRMED': The Stop Loss is only activated if the closing of the previous bar is in the loss limit condition. It's useful to prevent the SL from triggering when they do a ‘pump’ to sweep Stops and then return the price to the previous state.
█ ALERTS
There is an alert for each leverage, therefore a maximum of 8 alerts can be set for 'long' and 8 for 'short', plus an alert to close the trade with Take Profit or Stop Loss in market mode. You can also place Take Profit limit and Stop Loss limit orders a few seconds after filling the position entry order.
- 'MAXIMUM LEVERAGE': It is the maximum allowed multiplier of the % quantity entered on each entry for 1X according to the volume condition.
- 'ADVANCE ALERTS': There is always a time delay from when the alert is triggered until it reaches the exchange and can be between 1-15 seconds. With this parameter, you can advance the alert by the necessary seconds to activate it earlier. In this way it can be synchronized with the exchange so that the execution time of the entry order to the position coincides with the opening of the bar.
The settings are for Bitcoin at Binance Futures (BTC: USDTPERP) in 15 minutes.
For other pairs and other timeframes, the settings have to be adjusted again. And within a month, the settings will be different because we all know the market and the trend are changing.
스크립트에서 "Automated Trading"에 대해 찾기

888 BOT #backtest█ 888 BOT #backtest (open source)
This is an Expert Advisor 'EA' or Automated trading script for ‘longs’ and ‘shorts’, which uses only a Take Profit or, in the worst case, a Stop Loss to close the trade.
It's a much improved version of the previous ‘Repanocha’. It doesn`t use 'Trailing Stop' or 'security()' functions (although using a security function doesn`t mean that the script repaints) and all signals are confirmed, therefore the script doesn`t repaint in alert mode and is accurate in backtest mode.
Apart from the previous indicators, some more and other functions have been added for Stop-Loss, re-entry and leverage.
It uses 8 indicators, (many of you already know what they are, but in case there is someone new), these are the following:
1. Jurik Moving Average
It's a moving average created by Mark Jurik for professionals which eliminates the 'lag' or delay of the signal. It's better than other moving averages like EMA , DEMA , AMA or T3.
There are two ways to decrease noise using JMA . Increasing the 'LENGTH' parameter will cause JMA to move more slowly and therefore reduce noise at the expense of adding 'lag'
The 'JMA LENGTH', 'PHASE' and 'POWER' parameters offer a way to select the optimal balance between 'lag' and over boost.
Green: Bullish , Red: Bearish .
2. Range filter
Created by Donovan Wall, its function is to filter or eliminate noise and to better determine the price trend in the short term.
First, a uniform average price range 'SAMPLING PERIOD' is calculated for the filter base and multiplied by a specific quantity 'RANGE MULTIPLIER'.
The filter is then calculated by adjusting price movements that do not exceed the specified range.
Finally, the target ranges are plotted to show the prices that will trigger the filter movement.
Green: Bullish , Red: Bearish .
3. Average Directional Index ( ADX Classic) and ( ADX Masanakamura)
It's an indicator designed by Welles Wilder to measure the strength and direction of the market trend. The price movement is strong when the ADX has a positive slope and is above a certain minimum level 'ADX THRESHOLD' and for a given period 'ADX LENGTH'.
The green color of the bars indicates that the trend is bullish and that the ADX is above the level established by the threshold.
The red color of the bars indicates that the trend is down and that the ADX is above the threshold level.
The orange color of the bars indicates that the price is not strong and will surely lateralize.
You can choose between the classic option and the one created by a certain 'Masanakamura'. The main difference between the two is that in the first it uses RMA () and in the second SMA () in its calculation.
4. Parabolic SAR
This indicator, also created by Welles Wilder, places points that help define a trend. The Parabolic SAR can follow the price above or below, the peculiarity that it offers is that when the price touches the indicator, it jumps to the other side of the price (if the Parabolic SAR was below the price it jumps up and vice versa) to a distance predetermined by the indicator. At this time the indicator continues to follow the price, reducing the distance with each candle until it is finally touched again by the price and the process starts again. This procedure explains the name of the indicator: the Parabolic SAR follows the price generating a characteristic parabolic shape, when the price touches it, stops and turns ( SAR is the acronym for 'stop and reverse'), giving rise to a new cycle. When the points are below the price, the trend is up, while the points above the price indicate a downward trend.
5. RSI with Volume
This indicator was created by LazyBear from the popular RSI .
The RSI is an oscillator-type indicator used in technical analysis and also created by Welles Wilder that shows the strength of the price by comparing individual movements up or down in successive closing prices.
LazyBear added a volume parameter that makes it more accurate to the market movement.
A good way to use RSI is by considering the 50 'RSI CENTER LINE' centerline. When the oscillator is above, the trend is bullish and when it is below, the trend is bearish .
6. Moving Average Convergence Divergence ( MACD ) and ( MAC-Z )
It was created by Gerald Appel. Subsequently, the histogram was added to anticipate the crossing of MA. Broadly speaking, we can say that the MACD is an oscillator consisting of two moving averages that rotate around the zero line. The MACD line is the difference between a short moving average 'MACD FAST MA LENGTH' and a long moving average 'MACD SLOW MA LENGTH'. It's an indicator that allows us to have a reference on the trend of the asset on which it is operating, thus generating market entry and exit signals.
We can talk about a bull market when the MACD histogram is above the zero line, along with the signal line, while we are talking about a bear market when the MACD histogram is below the zero line.
There is the option of using the MAC-Z indicator created by LazyBear, which according to its author is more effective, by using the parameter VWAP ( volume weighted average price ) 'Z-VWAP LENGTH' together with a standard deviation 'STDEV LENGTH' in its calculation.
7. Volume Condition
Volume indicates the number of participants in this war between bulls and bears, the more volume the more likely the price will move in favor of the trend. A low trading volume indicates a lower number of participants and interest in the instrument in question. Low volumes may reveal weakness behind a price movement.
With this condition, those signals whose volume is less than the volume SMA for a period 'SMA VOLUME LENGTH' multiplied by a factor 'VOLUME FACTOR' are filtered. In addition, it determines the leverage used, the more volume , the more participants, the more probability that the price will move in our favor, that is, we can use more leverage. The leverage in this script is determined by how many times the volume is above the SMA line.
The maximum leverage is 8.
8. Bollinger Bands
This indicator was created by John Bollinger and consists of three bands that are drawn superimposed on the price evolution graph.
The central band is a moving average, normally a simple moving average calculated with 20 periods is used. ('BB LENGTH' Number of periods of the moving average)
The upper band is calculated by adding the value of the simple moving average X times the standard deviation of the moving average. ('BB MULTIPLIER' Number of times the standard deviation of the moving average)
The lower band is calculated by subtracting the simple moving average X times the standard deviation of the moving average.
the band between the upper and lower bands contains, statistically, almost 90% of the possible price variations, which means that any movement of the price outside the bands has special relevance.
In practical terms, Bollinger bands behave as if they were an elastic band so that, if the price touches them, it has a high probability of bouncing.
Sometimes, after the entry order is filled, the price is returned to the opposite side. If price touch the Bollinger band in the same previous conditions, another order is filled in the same direction of the position to improve the average entry price, (% MINIMUM BETTER PRICE ': Minimum price for the re-entry to be executed and that is better than the price of the previous position in a given %) in this way we give the trade a chance that the Take Profit is executed before. The downside is that the position is doubled in size. 'ACTIVATE DIVIDE TP': Divide the size of the TP in half. More probability of the trade closing but less profit.
█ STOP LOSS and RISK MANAGEMENT.
A good risk management is what can make your equity go up or be liquidated.
The % risk is the percentage of our capital that we are willing to lose by operation. This is recommended to be between 1-5%.
% Risk: (% Stop Loss x % Equity per trade x Leverage) / 100
First the strategy is calculated with Stop Loss, then the risk per operation is determined and from there, the amount per operation is calculated and not vice versa.
In this script you can use a normal Stop Loss or one according to the ATR. Also activate the option to trigger it earlier if the risk percentage is reached. '% RISK ALLOWED'
'STOP LOSS CONFIRMED': The Stop Loss is only activated if the closing of the previous bar is in the loss limit condition. It's useful to prevent the SL from triggering when they do a ‘pump’ to sweep Stops and then return the price to the previous state.
█ BACKTEST
The objective of the Backtest is to evaluate the effectiveness of our strategy. A good Backtest is determined by some parameters such as:
- RECOVERY FACTOR: It consists of dividing the 'net profit' by the 'drawdown’. An excellent trading system has a recovery factor of 10 or more; that is, it generates 10 times more net profit than drawdown.
- PROFIT FACTOR: The ‘Profit Factor’ is another popular measure of system performance. It's as simple as dividing what win trades earn by what loser trades lose. If the strategy is profitable then by definition the 'Profit Factor' is going to be greater than 1. Strategies that are not profitable produce profit factors less than one. A good system has a profit factor of 2 or more. The good thing about the ‘Profit Factor’ is that it tells us what we are going to earn for each dollar we lose. A profit factor of 2.5 tells us that for every dollar we lose operating we will earn 2.5.
- SHARPE: (Return system - Return without risk) / Deviation of returns.
When the variations of gains and losses are very high, the deviation is very high and that leads to a very poor ‘Sharpe’ ratio. If the operations are very close to the average (little deviation) the result is a fairly high 'Sharpe' ratio. If a strategy has a 'Sharpe' ratio greater than 1 it is a good strategy. If it has a 'Sharpe' ratio greater than 2, it is excellent. If it has a ‘Sharpe’ ratio less than 1 then we don't know if it is good or bad, we have to look at other parameters.
- MATHEMATICAL EXPECTATION: (% winning trades X average profit) + (% losing trades X average loss).
To earn money with a Trading system, it is not necessary to win all the operations, what is really important is the final result of the operation. A Trading system has to have positive mathematical expectation as is the case with this script: ME = (0.87 x 30.74$) - (0.13 x 56.16$) = (26.74 - 7.30) = 19.44$ > 0
The game of roulette, for example, has negative mathematical expectation for the player, it can have positive winning streaks, but in the long term, if you continue playing you will end up losing, and casinos know this very well.
PARAMETERS
'BACKTEST DAYS': Number of days back of historical data for the calculation of the Backtest.
'ENTRY TYPE': For '% EQUITY' if you have $ 10,000 of capital and select 7.5%, for example, your entry would be $ 750 without leverage. If you select CONTRACTS for the 'BTCUSDT' pair, for example, it would be the amount in 'Bitcoins' and if you select 'CASH' it would be the amount in $ dollars.
'QUANTITY (LEVERAGE 1X)': The amount for an entry with X1 leverage according to the previous section.
'MAXIMUM LEVERAGE': It's the maximum allowed multiplier of the quantity entered in the previous section according to the volume condition.
The settings are for Bitcoin at Binance Futures (BTC: USDTPERP) in 15 minutes.
For other pairs and other timeframes, the settings have to be adjusted again. And within a month, the settings will be different because we all know the market and the trend are changing.

Multi Time Frame Buy the Dips (by Coinrule)Buying the dips is a relatively easy automated trading strategy that can return impressive profits, especially during uptrend times. Not all price drops are for buying, though. This trading system is based on a multi time frame buy-the-dip approach to optimize each trade.
The strategy catches sudden price drops on a 1-hr time frame when the price increases significantly in the last 12 hours. During steep uptrends, profit-taking price actions result in flash crashes that provide great opportunity to enter at convenient prices.
Buy Condition
The setup of the script is optimized on a 30 min time frame. You can adjust the parameters to fit different time frames.
The system gets a buy signal when
- the price drops 1% from the two previous candles (1 hour time frame = two 30-min candles)
- the price is up 3% from the last 12 hours (twenty-four 30-min candles equal the desired time frame)
Sell Condition
Each trade comes with a stop loss of 3% and a take profit of 4%.
This setup has been optimized, running over 150 backtests on more than 20 different crypto trading pairs.
The strategy assumes each order to trade 30% of the available capital. A trading fee of 0.1% is taken into account. The fee is aligned to the base fee applied on Binance, which is the largest cryptocurrency exchange.

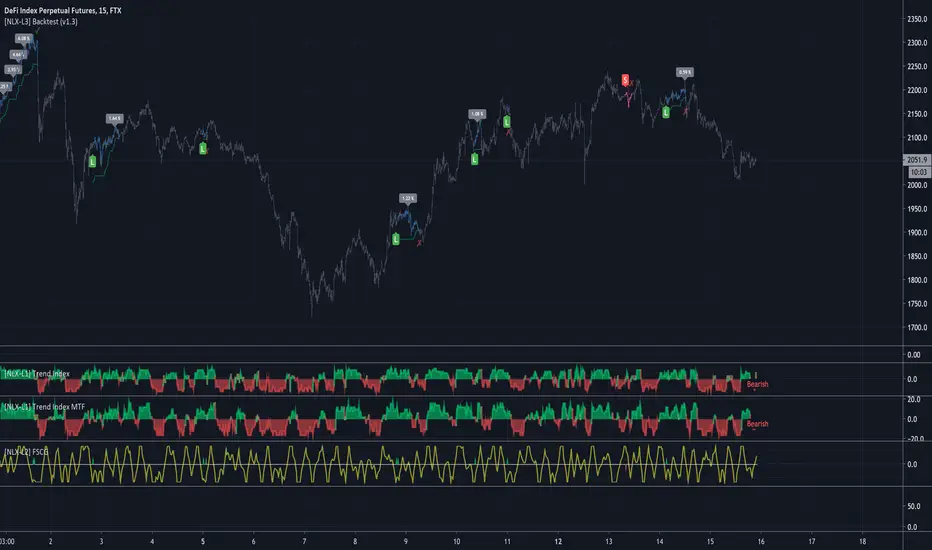
[NLX-L2] Fisher Stochastic Center of Gravity (v4)- Fisher Stochastic Center of Gravity-
This is Fisher's Stochastic Center of Gravity converted to pine v4 by blackcat. A very powerful entry indicator!
The original was published by DasanC & EmpiricalFX and it's a very interesting take on FSCG.
All the credit for the indicator goes to the authors and inventor of FSCG, this is just a mod to be used with my NLX Modular Trading Framework .
- How to Use -
1. Add a Trend Indicator like Trend Index MTF to your chart
2. Add " Fisher Stochastic Center of Gravity" Indicator to your Chart and select the Trend Index MTF with Type L1 in the Settings as Source
2. Add the Backtest to your Chart and select the FSCG Signal with Type L2 as Source
- Alerts for Automated Trading -
See my signature below for more information. Contact me for the Alert module.

[NLX-L1] Trend Index- NLX Modular Trading Framework -
This module is build upon the Trend Index by Mango2Juice (thanks for your permission to use the source!)
It includes all the common indicators and creates a positive or negative score, which can be used with my Modular Trading Framework and linked to an entry/exit indicator.
SuperTrend
VWAP Bands
Relative Strength Index ( RSI )
Commodity Channel Index ( CCI )
William Percent Range (WPR)
Directional Movement Index (DMI)
Elder Force Index ( EFI )
Momentum
Demarker
Parabolic SAR
... and more
- Getting Started -
1. Add this Trend Index to your Chart
2. Add one of my Indicator Modules to your Chart, such as the QQE++ Indicator
3. In the QQE Indicator Settings combine it with the Trend Index (and choose L1 Type)
4. Optional: Add the Noise Filter , and in the Noise Filter Settings you select the QQE Indicator as combination (and choose L2 for Type)
5. Add the Backtest Module to your Chart
6. Select the Noise Filter in the Backtest Settings
Indicator modules can be combined in many different ways in my framework - have fun!
- Alerts for Automated Trading -
The alerts module is coming soon and you will be able to create alerts to automated your trades.
See my signature below for more information.
Percent Calculator OverlayFirst and foremost: I'm inspired to publish my scripts by the other member's who publish quality, detailed scripts -a token of my appreciation and support, Thank You.
The percent calculator overlay is an extension of my Percent Calculator indicator that allows one to visualize the percent metrics they're interested in trading: it''s function is to simply output the target price from either the close or ones trade-entry based on a desired percent return on investment (R.O.I.) then plots it on top of the chart as an area plot and notes anytime in the past the desired conditions were met with a {flag "Success"}.
Say you want to profit 15% from your entry: open the settings and plug in your entry value and the number 15 into the appropriate settings and the indicator displays what the target price should be (rounded to two decimal places) right on the chart with the area as well as the horizontal line which is enabled by the "track price" setting.
The percent calculator overlay also goes one step further by finding the average percent return on investment over a desired interval of time (the default is 20 candles) as well as allows one to adjust the size of the price move the average percent return on investment is being calculated for which is displayed on the chart as circles and also displays a horizontal line for the most current value with the enabled "track price" setting.
NOTE: unlike the Percent Calculator the Percent Calculator Overlay creates a visual record of the number of success' the programmed parameters have achieved (based on the closing prices) which self adjusts when the "size of the move" is changed.
Say you want to find the average percent return on investment for a 3 candle swing over a 200 candle interval of time: open the settings and plug the number 200 into the interval setting and the number 3 into the price-move setting and the indicator displays what the average 3 candle swing returns on investment and plots what the target price would be to achieve the average return given the current close (or entry price) with the gray circles and the horizontal line enabled with the "track price" setting.
Practical Application: comparing ones desired return on investment to the average return on investment can help determine how realistic ones goals are... it's unlikely to achieve 100% return on investment if the average is only around 10% (given the parameters one is working within) but on the other hand achieving 5% return on investment is highly likely. By visualizing roughly how often the given parameters have achieved success on the chart one can become a lot more comfortable, confident, and accurate with their goals.
Forward Looking Statement: I believe in the not too distant future plug and play automated trading systems will be made available to the general public. Over the past 4 years we have seen brokers offer free charting software, commission free trading, and now fractional shares; I don't think it will be much longer before we can simply click a few buttons and tell the computer to enter when the stochastic is overbought/sold and exit with a predefined percent gain (and to repeat that process indefinitely). -Imagine the data moving 2-3-4 times a second, the liquidity flowing like Niagara falls, and 95% of the working population not only starting to invest but gains the extra cash flow they desperately need.
Beta testing: please comment or send me a message if you happen to stumble over any bugs or have any suggestions for improvement.

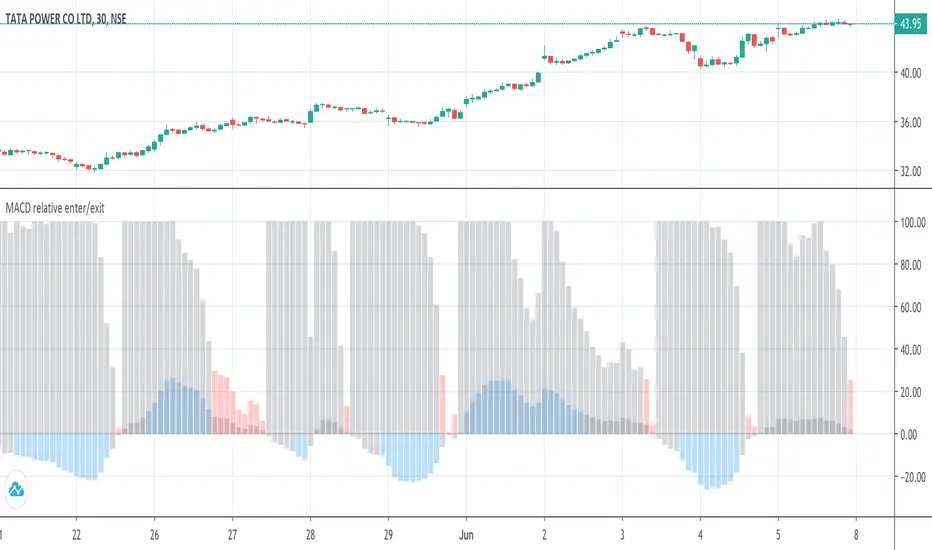
MACD histogram relative open/closePrelude
This script makes it easy to capture MACD Histogram open/close for automated trading.
There seems to be no "magic" value for MACD Histogram that always works as a cut-off for trade entry/exit, because of the variation in market price over time.
The idea behind this script is to replicate the view of the MACD graph we (humans) see on the screen, in mathematics, so the computer can approximately detect when the curve is opening/closing.
Math
The maths for this is composed of 2 sections -
1. Entry -
i. To trigger entry, we normalize the Histogram value by first determining the lowest and highest values on the MACD curves (MACD, Signal & Hist).
ii. The lowest and highest values are taken over the "Frame of reference" which is a hyperparameter.
iii. Once the frame of reference is determined, the entry cutoff param can be defined with respect to the values from (i) (10% by default)
2. Exit
To trigger an exit, a trader searches for the point where the Histogram starts to drop "steeply".
To convert the notion of "steep" into mathematics -
i. Take the max histogram value reached since last MACD curve flip
ii. Define the cutoff with reference to the value from (i) (30% by default)
Plots
Gray - Dead region
Blue - Histogram opening
Red - Histogram is closing
Notes
A good value for the frame of reference can be estimated by looking at the timescale of the graph you generally work with during manual trading.
For me, that turned out to be ~2.5 hours. (as shown in the above graph)
For a 3-minute ticker, frame of reference = 2.5 * 60 / 3 = 50
Which is the default given in this script.
Ultimately, it is up to you to do grid search and find these hyperparams for the stock and ticker size you're working with.
Also, this script only serves the purpose of detecting the Histogram curve opening/closing.
You may want to add further checks to perform proper trading using MACD.
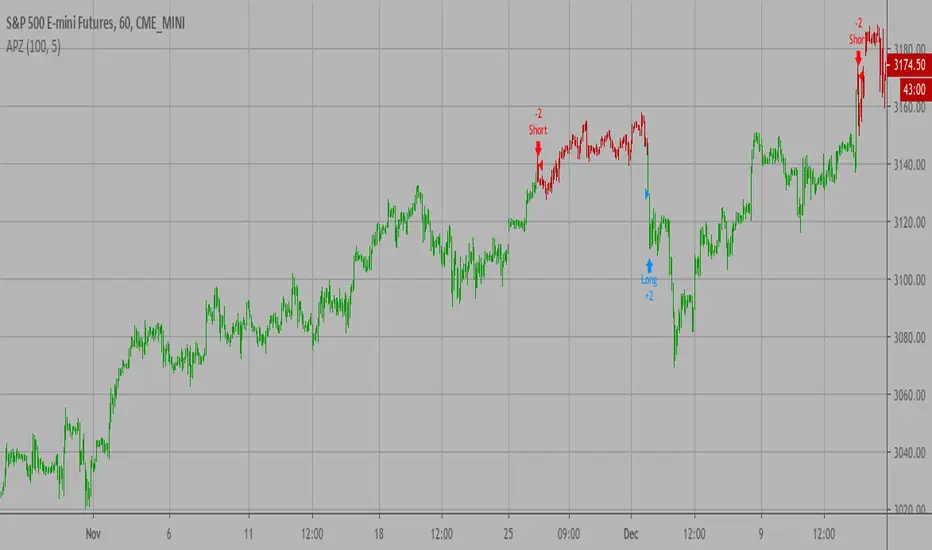
Adaptive Price Zone Backtest The adaptive price zone (APZ) is a volatility-based technical indicator that helps investors
identify possible market turning points, which can be especially useful in a sideways-moving
market. It was created by technical analyst Lee Leibfarth in the article “Identify the
Turning Point: Trading With An Adaptive Price Zone,” which appeared in the September 2006 issue
of the journal Technical Analysis of Stocks and Commodities.
This indicator attempts to signal significant price movements by using a set of bands based on
short-term, double-smoothed exponential moving averages that lag only slightly behind price changes.
It can help short-term investors and day traders profit in volatile markets by signaling price
reversal points, which can indicate potentially lucrative times to buy or sell. The APZ can be
implemented as part of an automated trading system and can be applied to the charts of all tradeable assets.
WARNING:
- For purpose educate only
- This script to change bars colors.
Adaptive Price Zone Strategy The adaptive price zone (APZ) is a volatility-based technical indicator that helps investors
identify possible market turning points, which can be especially useful in a sideways-moving
market. It was created by technical analyst Lee Leibfarth in the article “Identify the
Turning Point: Trading With An Adaptive Price Zone,” which appeared in the September 2006 issue
of the journal Technical Analysis of Stocks and Commodities.
This indicator attempts to signal significant price movements by using a set of bands based on
short-term, double-smoothed exponential moving averages that lag only slightly behind price changes.
It can help short-term investors and day traders profit in volatile markets by signaling price
reversal points, which can indicate potentially lucrative times to buy or sell. The APZ can be
implemented as part of an automated trading system and can be applied to the charts of all tradeable assets.
Green color is long.
Red color is short.
WARNING:
- For purpose educate only
- This script to change bars colors.

Adaptive Price Zone Indicator The adaptive price zone (APZ) is a volatility-based technical indicator that helps investors
identify possible market turning points, which can be especially useful in a sideways-moving
market. It was created by technical analyst Lee Leibfarth in the article “Identify the
Turning Point: Trading With An Adaptive Price Zone,” which appeared in the September 2006 issue
of the journal Technical Analysis of Stocks and Commodities.
This indicator attempts to signal significant price movements by using a set of bands based on
short-term, double-smoothed exponential moving averages that lag only slightly behind price changes.
It can help short-term investors and day traders profit in volatile markets by signaling price
reversal points, which can indicate potentially lucrative times to buy or sell. The APZ can be
implemented as part of an automated trading system and can be applied to the charts of all tradeable assets.

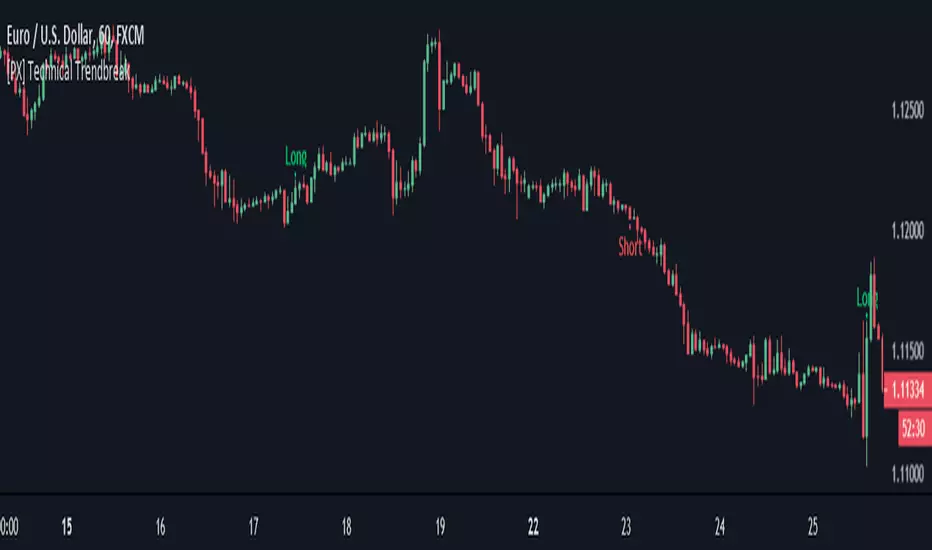
[PX] Technical TrendbreakThis script identifies a technical break of the current trend. Its shows when the swing point before the most recent extreme (high or low) is taken out. The indicator can help you to identify when the current trend is weakening or momentum is slowing down. It is not a standalone script, that you should use for automated trading. It works best when a clear trend is in progress and new extremes are made (such as all-time-high, all-time-low). It should be avoided for sideways movements.
The length parameter determines how many candles should be taken into consideration for calculation of the extremes.
If you are looking for someone to develop your own indicator or trading strategy, don't hesitate to get in touch with me here on TradingView or below.
Contact:
www.pascal-simon.de
info@pascal-simon.de
[CS] AMA Strategy - Channel Break-Out"There are various ways to detect trends with moving averages. The moving average is a rolling filter and uptrends are detected when either the price is above the moving average or when the moving average’s slope is positive.
Given that an SMA can be well approximated by a constant-α AMA, it makes a lot of sense to adopt the AMA as the principal representative of this family of indicators. Not only it is potentially flexible in the definition of its effective lookback but it is also recursive. The ability to compute indicators recursively is a very big positive in latency-sensitive applications like high-frequency trading and market-making. From the definition of the AMA, it is easy to derive that AMA > 0 if P(i) > AMA(i-1). This means that the position of the price relative to an AMA dictates its slope and provides a way to determine whether the market is in an uptrend or a downtrend."
You can find this and other very efficient strategies from the same author here:
www.amazon.com
In the following repository you can find this system implemented in lisp:
github.com
To formalize, define the upside and downside deviations as the same sensitivity moving averages of relative price appreciations and depreciations
from one observation to another:
D+(0) = 0 D+(t) = α(t − 1)max((P(t) − P(t − 1))/P(t − 1)) , 0) + (1 − α(t − 1))D+(t − 1)
D−(0) = 0 D−(t) = −α(t − 1)min((P(t) − P(t − 1))/P(t − 1)) , 0)+ (1 − α(t − 1))D−(t − 1)
The AMA is computed by
AMA(0) = P(0) AMA(t) = α(t − 1)P(t) + (1 − α(t − 1))AMA(t − 1)
And the channels
H(t) = (1 + βH(t − 1))AMA(t) L(t) = (1 − βL(t − 1))AMA(t)
For a scale constant β, the upper and lower channels are defined to be
βH(t) = β D− βL(t) = β D+
The signal-to-noise ratio calculations are state dependent:
SNR(t) = ((P(t) − AMA(t − 1))/AMA(t − 1)) / β D−(t) IfP(t) > H(t)
SNR(t) = −((P(t) − AMA(t − 1))/AMA(t − 1)) / β D−(t) IfP(t) < L(t)
SNR(t) = 0 otherwise.
Finally the overall sensitivity α(t) is determined via the following func-
tion of SNR(t):
α(t) = αmin + (αmax − αmin) ∗ Arctan(γ SNR(t))
Note: I added a moving average to α(t) that could add some lag. You can optimize the indicator by eventually removing it from the computation.

Cryptohopper OBVCryptohopper is an automated trading platform where you can automate your strategy based on technical indicators and candlestick patterns. OBV is one the indicators that you can automate with Cryptohopper.
How can you automate it? OBV gives a Buy signal when the OBV value crosses up its moving average (default: EMA) and a Sell signal when it crosses down its moving average.
If you include volume analyses in your trading strategy, automating OBV will give buy signals whenever volume and price are rising altogether.
Start automating your trading in Cryptohopper.com
--CRYPTOHOPPER--

5 MAs w. alerts [LucF]Is this gazillionth MA indicator worth an addition to the already crowded field of contenders? I say yes! This one shows up to 5 MAs and 6 different marker conditions that can be used to create alerts, among many other goodies.
Features
MAs can be darkened when they are falling.
MAs from another time frame can be displayed, with the option of smoothing them.
Markers can be filtered to Longs or Shorts only.
EMAs can be selected for either all or the two shortest MAs.
The background can be colored using any of the marker states except no. 3.
Markers are:
1. On crosses between any two user-defined MAs,
2. When price is above or below an MA,
3. On Quick Flips (a specific setup involving a cross, multiple MA states and increasing volume, when available),
4. When the difference between two MAs is within a % of its high/low historic values,
5. When an MA has been rising/falling for n bars,
6. When the difference between two MAs is greater than a multiple of ATR.
Some markers use similar visual cues, so distinguishing them will be a challenge if they are used concurrently.
Alerts
Alerts can be created on any combination of alerts. Only non-consecutive instances of markers 5 and 6 will trigger the alert condition. Make sure you are on the interval you want the alert to run at. Using the “Once Per Bar Close” trigger condition is usually the best option.
When an alert is created in TradingView, a snapshot of the indicator’s settings is saved with the alert, which then takes on a life of its own. That is why even though there is only one alert to choose from when you bring up the alert creation dialog box and choose “5 MAs”, that alert can be triggered from any number of conditions. You select those conditions by activating the markers you want the alert to trigger on before creating the alert. If you have selected multiple conditions, then it can be a good idea to record a reminder in the alert’s message field. When the alert triggers, you will need the indicator on the chart to figure out which one of your conditions triggered the alert, as there is currently no way to dynamically change the alert’s message field from within the script.
Background settings will not trigger alerts; only marker configurations.
Notes
MAs are just… averages. Trader lure would have them act as support and resistance levels. I’m not sure about that, and not the only one thinking along these lines. Adam Grimes has studied moving averages in quite a bit of detail. His numbers point to no evidence indicating they act as support/resistance, and to specific MA lengths not being more meaningful than others. His point of view is debated by some—not by me. Mean reversion does not entail that price stops when it reaches its MA; rather, it makes sense to me that price would often more or less oscillate around its MA, which entails the MA does not act as support/resistance. Aren’t the best mean reversion opportunities when price is furthest away from its MA? If so, it should be more profitable to identify these areas, which some of this indicator’s markers try to do.
I think MAs can be much more powerful when thought of as instruments we can use to situate price events in contexts of various resolutions, from the instantaneous to the big picture. Accordingly, I use the relative positions and slopes of MAs in both discretionary and automated trading; but never their purported ability to support/resist.
Regardless of how you use MAs, I hope you will find this indicator useful.
Biased References
The Art and Science of Technical Analysis: Market Structure, Price Action, and Trading Strategies, Adam Grimes, 2012.
Does the 200 day moving average “work”?
Moving averages: digging deeper

CS Basic Scripts - Stochastic Special (Strategy)This Stochastic Special Strategy features inputs for:
- Custom Backtesting Date Range
- Long and Short Strategy Discinctions
- Utilize SMI, RSI, Martingale, and Body-Filter Strategy
- Adjust the SMI Percent Lengths and Limit
- Automate with the Autoview Trading Bot
Strategy script may be tested by favoriting and adding to any chart.
Study script is available for automated trading at www.cryptoscores.org

Build A Bot Hull TriggerThis is the automated trading system we built during the 60-Minute Build-A-Bot webinar on September 12, 2018. We had a lot of fun, and implemented a TON of indicators LIVE during this webinar! And the best part is that as a group we researched, designed, and built a profitable robot in exactly 60 minutes!
We started by voting on the type of trading system, and this is a trend following system because it got the most votes. Then, the attendees in the webinar sent in their suggestions for indicators and settings during the live webinar (still counting toward the 60 minutes). Once we had the indicators on the chart, and we discussed various settings we could use, we got to work building the robot, and ran the first strategy test...and it was profitable!
This version uses the Hull Moving Average as a trigger for initiating the trade, and everything else is the same for the filters. The other version uses the CCI as a trigger for the trade, and many other indicators as filters.

Riz Coloured MACD - StudyThis is a souped up common or garden MACD . The Histogram is coloured giving a clear visual representation of where we are UpTicking or DownTicking on the Histogram to help support trading decisions.
When colour changes from pink to green market is bullish , and visa versa.
Very useful as a supporting indicator to confirm other strategies, or even as a standalone strategy to some extent.
Backtesting of strategy is enabled by converting script from a Study to a strategy, see comments in code. This version focuses on this indicators use as a day to day study rather than a useful strategy for automated trading.

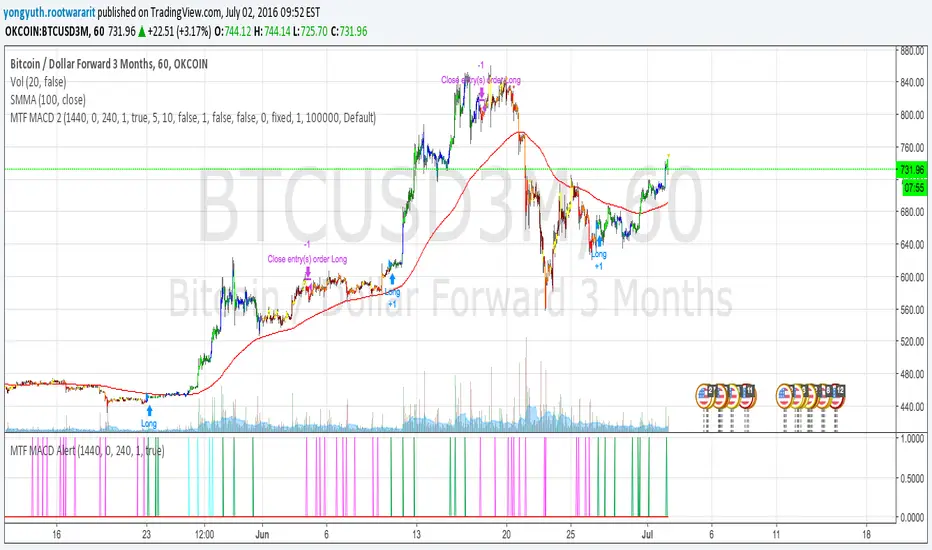
MTF MACD 2 By YuthavithiIf you want a good strategy without repaint. This one might be for you. Excellent profitable for BTCUSD3M for OKCoin.
It uses multiple time frame MACD for trading decision. To avoid repaint, set the delay period = 1 for both long term and midterm.
The idea is that, if long term, mid term and current time frame all agree on traidng direction, the trade will take place.
I also uses it in my automated trading bot with good result.
www.tradingview.com
Vandan V2Vandan V2 is an automated trading strategy for NQ1! (E-mini Nasdaq-100) based on short-term mean reversion with dynamic risk control. It combines volatility filters and overbought/oversold signals to capture local market imbalances.
Backtested from 2015 to 2025, it achieved a +730% total return, Profit Factor of 1.40, max drawdown of only 1.61%, and over 106,000 trades. Designed for systematic scalping or intraday arbitrage with a limit of 3 simultaneous contracts.

Three-Bar Reversal/ContinuationThis indicator identifies a three-bar expansion pattern based on range and volume, designed to highlight moments when the market pushes strongly, pauses, and then resumes with confirmation.
Detection Logic
* Bar (two bars ago) must show sufficient strength, determined by the number of conditions met.
* Bar (one bar ago) must be neutral (strength = 0), marking a brief pause.
*Bar (current bar) must continue the expansion, with range and volume greater than the prior bar.
(Bar is used as a safeguard to prevent repeated detection during ongoing strong moves)
Strength Scoring
Each bar is scored 0–3 based on which of the following conditions it satisfies:
* Range exceeds a multiple of the recent average
* Volume exceeds a multiple of the recent average
* Range × volume exceeds a multiple of the recent average
The detection level input controls how many of these conditions must hold to classify a bar as “strong.” This allows tuning from permissive (1 condition) to strict (all 3 conditions).
Parameters & Utility
* length: Lookback period for moving averages of span, volume, and span×volume. Larger values smooth the averages, reducing false positives; smaller values increase sensitivity.
* coeff: Multiplicative threshold to define an unusually strong bar. Higher values reduce frequency but increase reliability.
* detectLevel: Minimum number of conditions that must be met for a bar to count as “strong.”
* showCont: Whether to allow continuation signals away from local extrema (if false, only reversals near highs/lows are considered).
* symbolUp / symbolDown: Customizable plotting symbols for bullish/bearish signals.
* showStrength: Plots tiny dots indicating the strength of each bar (1–3).
Rationale
This structure captures a recurring market motif: strong push → brief pause → renewed push, where the renewed activity is confirmed by both price expansion and volume. Using a combination of statistical thresholds (range, volume, range×volume) and price structure ensures that signals are both measurable and visually interpretable.
Usage Notes
* This setup allows traders to visually or systematically identify potential reversal or continuation points while controlling sensitivity to noise.
* Designed as a mechanical filter rather than a fully automated trading system. Signals highlight notable activity but do not dictate entry, exit, or risk management.
* Works best when combined with trend/context filters or higher-timeframe analysis.
* Adjust the parameters based on the volatility of the instrument and timeframe.

RSI Classic calculationClassic RSI with Moving Average
This script implements the Classic RSI (Relative Strength Index) method with the option to use either an Exponential Moving Average (EMA) or a Simple Moving Average (SMA) for smoothing the gains and losses. This custom implementation primarily aims to resolve a specific issue I encountered when cross-referencing RSI values with Python-based data, which is calculated differently than in Pine Script. However, the methodology here can benefit anyone who needs to align RSI calculations across different programming languages or platforms.
The Problem:
When working with Python for data analysis, the RSI values are calculated differently. The smoothing method, for example, can vary—RMA (Relative Moving Average) may be used instead of SMA or EMA, resulting in discrepancies when comparing RSI values across systems. To solve this problem, this script allows for the same type of smoothing to be applied (EMA or SMA) as used in Python, ensuring consistency in the data.
Why This Implementation:
The main goal of this approach was to align RSI calculations across Python and Pine Script so that I could cross-check the results accurately. By offering both EMA and SMA options, this script bridges the gap between Pine Script and Python, ensuring that the data is comparable and consistent. While this particular issue arose from my work with Python, this solution is valuable for anyone dealing with cross-platform RSI comparisons in different coding languages or systems.
Benefits:
Cross-Platform Consistency: This script ensures that RSI values calculated in Pine Script are directly comparable to those from Python (or any other platform), which is crucial for accurate analysis, especially in automated trading systems.
Flexibility: The ability to choose between EMA and SMA provides flexibility in line with the specific needs of your strategy or data source.
Ease of Use: The RSI is plotted with overbought and oversold levels clearly marked, making it easy to visualize and use in decision-making processes.
Limitations:
Calculation Differences: While this script bridges the gap between Pine Script and Python, if you're working with a different platform or coding language that uses variations like RMA, small discrepancies may still arise.
Sensitivity Trade-Off: The choice between EMA and SMA impacts the sensitivity of the RSI. EMA responds quicker to recent price changes, which could lead to faster signals, while SMA provides a more stable but slower response.
Conclusion:
This Classic RSI script, with its customizable moving average type (EMA or SMA), not only solves the issue I faced with Python-based calculations but also provides a solution for anyone needing consistency across different programming languages and platforms. Whether you're working with Pine Script, Python, or other languages, this script ensures that your RSI values are aligned for more accurate cross-platform analysis. However, always be mindful of the small differences that can arise when different smoothing techniques (like RMA) are used in other systems.

Wick Detection (1 and 0) - AYNETDetailed Scientific Explanation
1. Wick Detection Logic
Definition of a Wick:
A wick, also known as a shadow, represents the price action outside the range of a candlestick's body (the region between open and close).
Upper Wick: Occurs when the high value exceeds the greater of open and close.
Lower Wick: Occurs when the low value is lower than the smaller of open and close.
Upper Wick Detection:
pinescript
Kodu kopyala
bool has_upper_wick = high > math.max(open, close)
This checks if the high price of the candle is greater than the maximum of the open and close prices. If true, an upper wick exists.
Lower Wick Detection:
pinescript
Kodu kopyala
bool has_lower_wick = low < math.min(open, close)
This checks if the low price of the candle is less than the minimum of the open and close prices. If true, a lower wick exists.
2. Binary Representation
The presence of a wick is encoded as a binary value for simplicity and computational analysis:
Upper Wick: Represented as 1 if present, otherwise 0.
pinescript
Kodu kopyala
float upper_wick_binary = has_upper_wick ? 1 : 0
Lower Wick: Represented as 1 if present, otherwise 0. This value is inverted (-1) for visualization purposes.
pinescript
Kodu kopyala
float lower_wick_binary = has_lower_wick ? 1 : 0
3. Visualization with Histograms
The plot function is used to create histograms for visualizing the binary wick data:
Upper Wicks: Plotted as positive values with green columns:
pinescript
Kodu kopyala
plot(upper_wick_binary, title="Upper Wick", color=color.new(color.green, 0), style=plot.style_columns, linewidth=2)
Lower Wicks: Plotted as negative values with red columns:
pinescript
Kodu kopyala
plot(lower_wick_binary * -1, title="Lower Wick", color=color.new(color.red, 0), style=plot.style_columns, linewidth=2)
Features and Applications
1. Wick Visualization:
Upper wicks are displayed as positive green columns.
Lower wicks are displayed as negative red columns.
This provides a clear visual representation of wick presence in historical data.
2. Technical Analysis:
Wick formations often indicate market sentiment:
Upper Wicks: Sellers pushed the price lower after buyers drove it higher, signaling rejection at the top.
Lower Wicks: Buyers pushed the price higher after sellers drove it lower, signaling rejection at the bottom.
3. Signal Generation:
Traders can use wick detection to build strategies, such as identifying key price levels or market reversals.
Enhancements and Future Improvements
1. Wick Length Measurement
Instead of binary detection, measure the actual length of the wick:
pinescript
Kodu kopyala
float upper_wick_length = high - math.max(open, close)
float lower_wick_length = math.min(open, close) - low
This approach allows for thresholds to identify significant wicks:
pinescript
Kodu kopyala
bool significant_upper_wick = upper_wick_length > 10 // For wicks longer than 10 units.
bool significant_lower_wick = lower_wick_length > 10
2. Alerts for Long Wicks
Trigger alerts when significant wicks are detected:
pinescript
Kodu kopyala
alertcondition(significant_upper_wick, title="Long Upper Wick", message="A significant upper wick has been detected.")
alertcondition(significant_lower_wick, title="Long Lower Wick", message="A significant lower wick has been detected.")
3. Combined Wick Analysis
Analyze both upper and lower wicks to assess volatility:
pinescript
Kodu kopyala
float total_wick_length = upper_wick_length + lower_wick_length
bool high_volatility = total_wick_length > 20 // Combined wick length exceeds 20 units.
Conclusion
This script provides a compact and computationally efficient way to detect candlestick wicks and represent them as binary data. By visualizing the data with histograms, traders can easily identify wick formations and use them for technical analysis, signal generation, and volatility assessment. The approach can be extended further to measure wick length, detect significant wicks, and integrate these insights into automated trading systems.

Super Trend ReversalsMain Concept
The core idea behind the Super Trend Reversals indicator is to assess the momentum of automated trading bots (often referred to as 'Supertrend bots') that enter the market during critical turning points. Specifically, the indicator is tuned to identify when the market is nearing bottoms or peaks, but just before it shifts direction based on the triggered Supertrend signals. This approach helps traders engage with the market right as the reversal momentum builds up, allowing for entry just as conditions become favorable and exit before momentum wanes.
How It Works
The Super Trend Reversals uses multiple Supertrend calculations, each with different period and multiplier settings, to form a comprehensive view of the trend. The total trend score from these calculations is then analyzed using the Relative Strength Index (RSI) and Exponential Moving Averages (EMA) to gauge the strength and sustainability of the trend.
A key feature of this indicator is the isCurrentRangeSmaller() function, which evaluates if the current price range is lower than the average over the recent period. This function is critical as it helps determine the stability of the market environment, reducing the likelihood of entering or exiting trades based on erratic price movements that could lead to false signals.
